
Thinking of Building a Contact-tracing Application? Here's what you can do instead.
Using technology to foster sustainability in your community
aging tutorial
- 🗓️ Date:
- 🗓️ Last modified:
- ⏱️ Time to read:
Table of Contents
2012, Terminator, World War Z, Avengers — Endgame. Over the years, movies featuring apocalyptic events have been a favorite amongst movie-goers. Many of them featured the Earth nearly coming to an end in a myriad of ways — from killer zombies to aliens, or something about the planet’s core getting unstable. They all usually end up with a hero (or a team of heroes) saving the world from the brink of destruction. And everything’s back to normal.
Except the year 2020 brought us the Coronavirus — something that none of the movies prepared us for. Although calling COVID-19 an apocalypse might be a bit of a stretch, it's not too far from the next worst thing — a Pandemic. The thing about post-apocalyptic movies, you see, is that there's always a Deus ex machina that brings everyone back from the edge of the abyss. I mean, how many of us have at least fantasized about this, for example?
Unfortunately in the real world, we don’t have one.
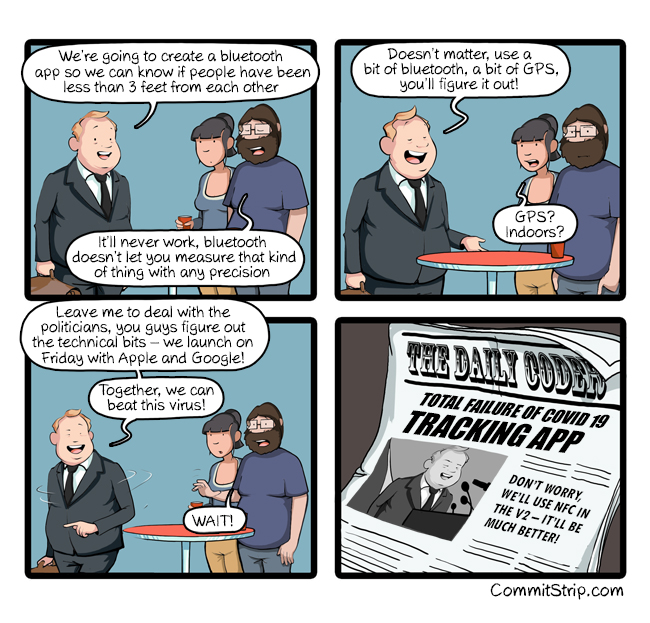
So while our scientists toil hard to produce vaccines for COVID-19, countries around the world have been making attempts to address the problems that have arisen due to the pandemic. Technology solutions, in particular, have an immense potential in raising awareness and slowing down the spread of disease. Unfortunately, besides contact-tracing applications and daunting dashboards that display disease stats, most efforts have only been marginally effective.
Let’s look at some stats
You probably are keeping an eye on the numbers related to COVID-19 case reports already. But there are several other kinds of stats that matter too, in the long run!
Over the course of the year, numerous studies have shed light on how COVID-19 has affected people and shaped up some significant behavioral patterns. Here are some highlights:
- Most people are uncomfortable with visiting public spaces and are apprehensive in stepping out, doing so only for purchasing essentials, like Groceries, household supplies, and medicines.
- About 40% of consumers prefer to have their products locally sourced. However, the projections for online grocery sales also indicate an increase by almost the same amount. More people are switching to e-commerce platforms for purchasing groceries and medicine, citing hygiene and fear of exposure to the virus as the top concerns.
- Online shopping has created a massive dislocation in local businesses. A survey in the US revealed that out of a sample size of 5800 businesses, 43% had temporarily closed! The biggest reason being that there was no reliable shipping, and most didn’t have enough capital to set up a digital infrastructure for their consumers. At the same time, businesses that do manage to provide a reliable delivery option are expected to see nearly 16% increase in revenue.
Now that you know this, how do you make sense of it all?
To put it succinctly, the need of the hour is:
- Effective means to shop for essentials online and optimize distribution.
- Improve offline shopping experience in a manner that poses the least risk of exposure.
- Serve the neighborhood and local businesses.
Enter Kartpool
We at Egen decided to build Kartpool — a community-driven delivery app and platform for connecting residents with local businesses.
After some good old fashioned design thinking, these were the following key features that we agreed upon:
Feature #1: Residents will be able to look at stores in their vicinity and look at the inventory. They can then add a wishlist of essentials that they intend to buy and place a request, which would be visible to other residents.
Feature #2: Any other resident can choose to accept this person’s request and become a wishmaster. Then, they can purchase the items from the store on behalf of the requestor and deliver it to them.
Feature #3: Users can give karma points to runners via a recognition and appreciation system, for being good samaritans and helpful members of the community.
Why Community-first?
Government imposed lockdowns will only take us so far. The focus must change to community participation — a bottom-up approach, unlike the top-down directives initiated by the world’s governments so far. Talking about the biggest lessons from the Ebola epidemic of 2014, the WHO said that “community engagement is the one factor that underlies the success of all other control measures.”
This means, providing your community with access to digital tools that assist in getting timely access to essentials, while at the same time observing containment protocols, and also helping local businesses and livelihoods.
So, if you’re a developer and feel the need to scratch that programming itch, keep reading! I’ll walk you through how to build this application that will be useful to your community and neighborhood during this crisis!
What you will build
In this tutorial, you’ll learn to build a minimum viable solution that you’ll be able to present within your community. At the end of this tutorial, you will have:
- A client-facing app that runs in a browser, in which users will be able to view nearby stores and wishlists. They can accept to pickup wishlists from other users and also make wishlists of their own.
- A backend server to handle incoming requests and to interact with the database.
- A database to store and retrieve information on nearby stores, wishlists, and users in the neighborhood.
Since this is a programming tutorial, your focus will not be much on web design, (though you’re welcome to do so if you wish! ). It’ll primarily be about building this service that has an immediate and long-lasting practical and utilitarian benefit.
Technologies that you will learn and use
- You’ll learn to use PostgreSQL as your database. It’s fast, extremely extensible to a wide array of needs (including hyperlocal business applications), has support for both SQL and NO-SQL data models, and is scalable.
- You’ll use Python with Django for the back-end. It’s a very robust and well-maintained framework, specially designed to accelerate building web services. It’s also compatible with major databases like PostgreSQL.
- On the front-end, you’ll be using HTML, CSS and JavaScript, and also a few other libraries like Mapbox.
Prerequisites
- It will be helpful to have at least a theoretical understanding of how relational database systems work.
- Some knowledge of JavaScript and Python will also help.
Contents
Part 1 (what you’re reading right now)
You’ll begin with the first feature of this application. For this feature to work, you’ll build an API that fetches all stores from a nearby location along with their inventory information, and display it to the user. Here’s what we’ll cover:
- PostgreSQL schema design and modeling
- Using PostgreSQL geospatial querying capabilities
- Using Django and Mapbox to build a Location-based store discovery service
In
Part 2
we’ll extend this service and add the ability for users to create wishlists and accept wishlists from other users.
Let’s get started!
Go to this link, and follow the instructions to install all the necessary project dependencies. Some of the libraries, python modules and methods have already been imported in the code for you to use.
PostgreSQL
PostgreSQL is amongst the most popular relational databases used all over the world, being in the top 2 widely used databases for 2 years in a row in 2019 and 2020. It has a very high compliance with SQL standards, supports a wide range of native data types (including custom types as well as JSON!), and is extremely extensible.
You’ll be using PostgreSQL along with PostGIS — an extension that allows you to store geographic and spatial data in PostgreSQL. It makes your DBMS location aware. and comes with some really cool features!
Designing the schema
Broadly speaking, your app has 3 kinds of entities:
- Store: Any shop that sells items to people in the nearby vicinity.
- User: A user in the system can be someone who issues a request for items to purchase from a store, or they can also be a runner who can collect items on behalf of another user.
- Wishlist: A user can create a wishlist of items that they need, which can be bought from a nearby store. This wishlist will be visible to other users in the neighrborhood, and one of them can volunteer to take a trip to the store and buy those items.
We could imagine more entities in the system but these will suffice for now. If you built data models for each of the above entities, what would they look like? Take a moment to think!
Next, fire up your terminal and run psql to enter the PostgreSQL interactive terminal. Once it opens up, you can look at the existing databases in PostgreSQL by typing \l.
You’ll need to create a new database for your application. Let’s call it kartpool. Run CREATE DATABASE kartpool; to create a new database.
For applying queries to this database, you’ll need to switch to it by typing \c kartpool. Here are some commonly used queries:
\l: List available databases\dt: List existing tablesSELECT * FROM stores: Will print all rows and columns in thestorestable.DROP TABLE <tablename>: Will delete the tableDROP DATABASE kartpool: Deletes the database
Now as you may already know, in a relational database, data is usually stored in rows and columns, and the usual data-types can be text, numeric, unique identifiers, images — which is sufficient for most applications. However, when you’re building an application that has a location-based feature, you need for a way to be able to store spatial information as well!
And here is where PostGIS helps! In addition to the existing data-types and querying that PostgreSQL provides, PostGIS introduces some more data-types, and also provides you with querying capabilities, especially for geographical information.
You’ll be working with the Point datatype, because that will allow you to store location information of a store using its geographic coordinates. Then, if you have the user’s location, you’ll be able to query for stores within their proximity!
For the purposes of this tutorial, you won’t dive into the SQL commands — as it can become quite hard to get a hold of the syntax!

So instead, you’ll learn to use Django’s Object Relational-mapping (ORM) layer to interact with the database. That way, if you switch the database from PostgreSQL to another one that’s supported by Django, your python code still remains the same!
Django
Django has been consistently rated among the most popular Python frameworks for multiple years in a row. It supports the Model-View-Template pattern, which allows you to maintain a robust architecture in your code, as the application grows with time. It also has “batteries” included — meaning that it comes with an admin panel and an extensive set of plugins for building just about anything ranging from authentication services to payment systems.
Django also comes along with an ORM system by default, which you’ll be using to interact and query your PostgreSQL database.
Now, each Django project consists of one or more applications. A Django app allows you to encapsulate a set of related functionality along with its models, views and application logic together. For this project, you’ll have the following apps:
stores: All store-related functionality (such as storing or fetching nearby stores) will go here.wishlists: This will contain all the logic required to create/update or retrieve wishlists.home: You’ll use this app to serve the app page in the browser along with client side JavaScript files, stylesheets, and for loading external libraries like Mapbox.
You’ll first define the model for store-related information instores/models.py. Open the file in your favorite editor and write the following:
Here you’ve basically defined a class for your Store, along with its fields and data-types. The location field, in particular, is of type Point — so that allows you to store information using a pair of coordinates.
Now, you’ll need to tell Django to create the store table in PostgreSQL. In your terminal, run the following:
python manage.py makemigrations
python manage.py migrate
This will have the effect of creating a table called stores_store! This is the equivalent of running an SQL query using psql :
CREATE TABLE stores_store (
    id BIGINT GENERATED BY default AS IDENTITY PRIMARY KEY,
    name VARCHAR(100) NOT NULL,
    store_type VARCHAR(50),
    created_at TIMESTAMPTZ,
    rating float,
    opening_hour TIME,
    closing_hour TIME,
    city VARCHAR(50),
    latitude float,
    longitude float,
    location GEOGRAPHY,
    address VARCHAR(255),
    phone VARCHAR(100)
);
Next, you’ll need to populate some data! Wouldn’t it be awesome if you could find some real data to populate your database?
Well lucky for you, we have —
Open Street Maps
A collaborative project, that has real-world location information of billions of areas of interest — collected and aggregated by good samaritans all over the world! Plenty of non-profits have built useful services 1 on top of OSM, like Wheelmap for example:
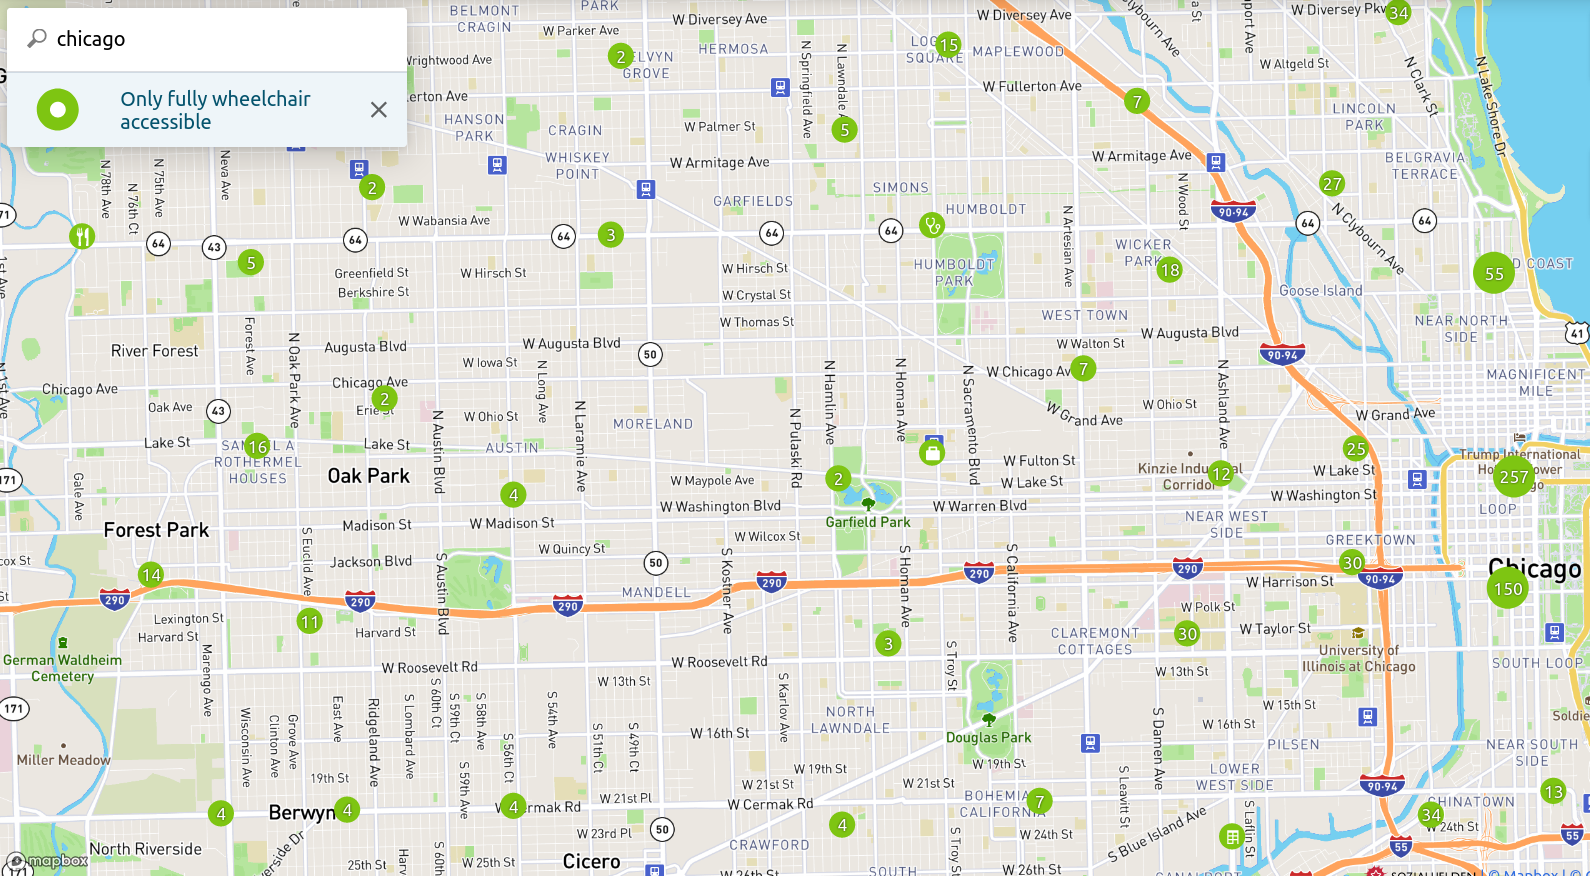
Pretty amazing right?
Now, what if I told you that all OSM data is in-fact stored in — (surprise), PostgreSQL?! Thanks to these folks, you can pretty much pull information from anywhere you live!
In order to mine information from OSM, there is a neat little tool called Overpass Turbo 2. Header over there, and click on the Wizard option. If you live in Chicago, you can type something like shop in Chicago which will run a query to pull out all shop-related information within the region. Once the query has run, download the data in raw OSM format and save it as data.json in the data folder of your project.
Now, run python manage.py makemigrations stores --empty to create a new empty migration file, and add the following code:
In this code, you’ve defined an operation to be run called load_data . This method uses the json library to load the file you just downloaded, and loops over each object that contains information for a particular store. You then pick the information you need, create a Store instance and then save it.
Now, you can run python manage.py migrate once again, and it will extract the stores from the JSON dump, and save them in the db. You can run SELECT * FROM stores_store from psql and see the results!
Now that you have a database with spatial querying capabilities that has actual real data stored in it, you can now create a useful application:
A Location-based store discovery service
Here’s what you’ll build:
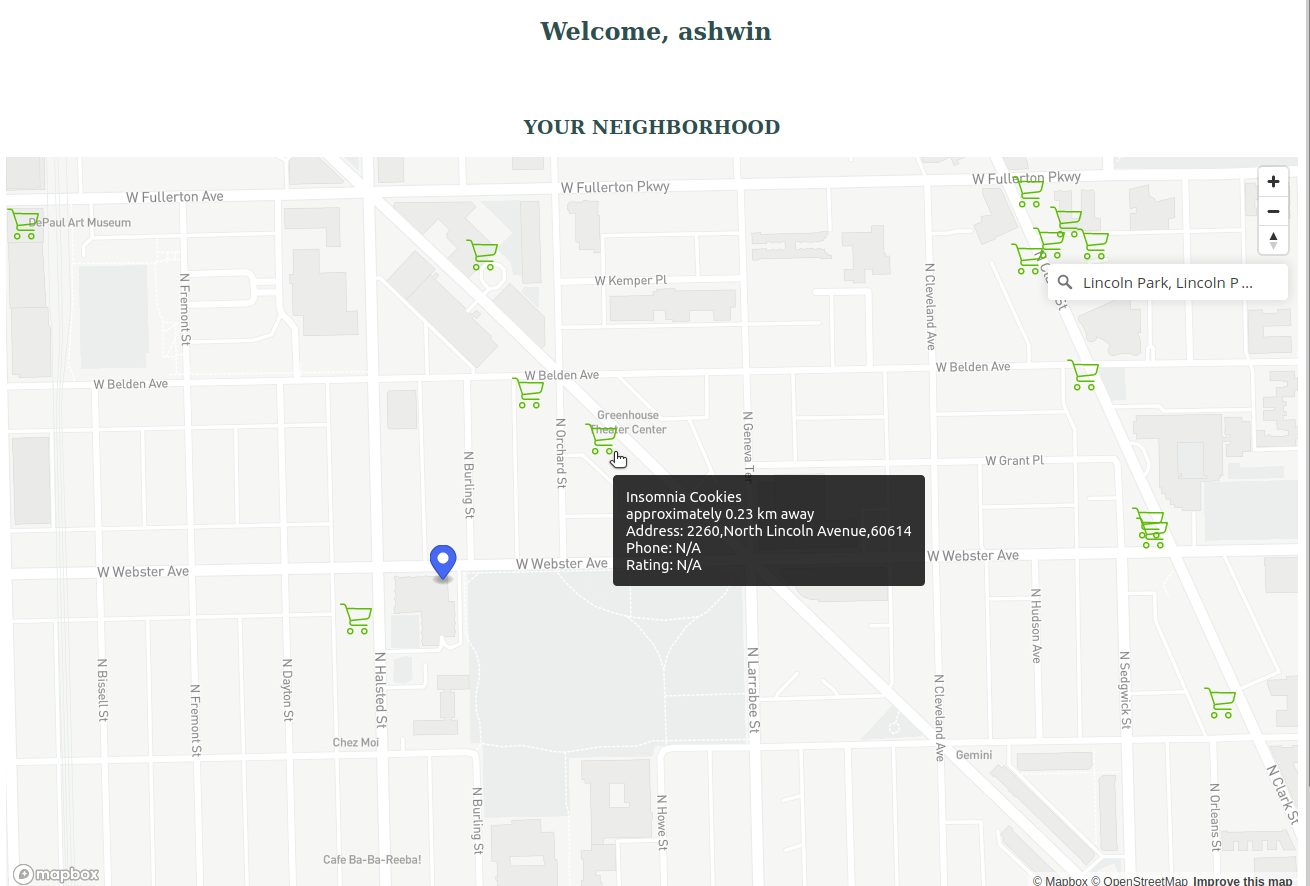
- On the UI, you’ll have a map with a search box. A user can type in the name of a place (where they live) on the search box to perform a search.
- The search box will make automatic suggestions as the user types.
- On selecting the place from the search results, the app hits an API and fetches the relevant stores information near to that location.
- The store locations will then be displayed on the map.
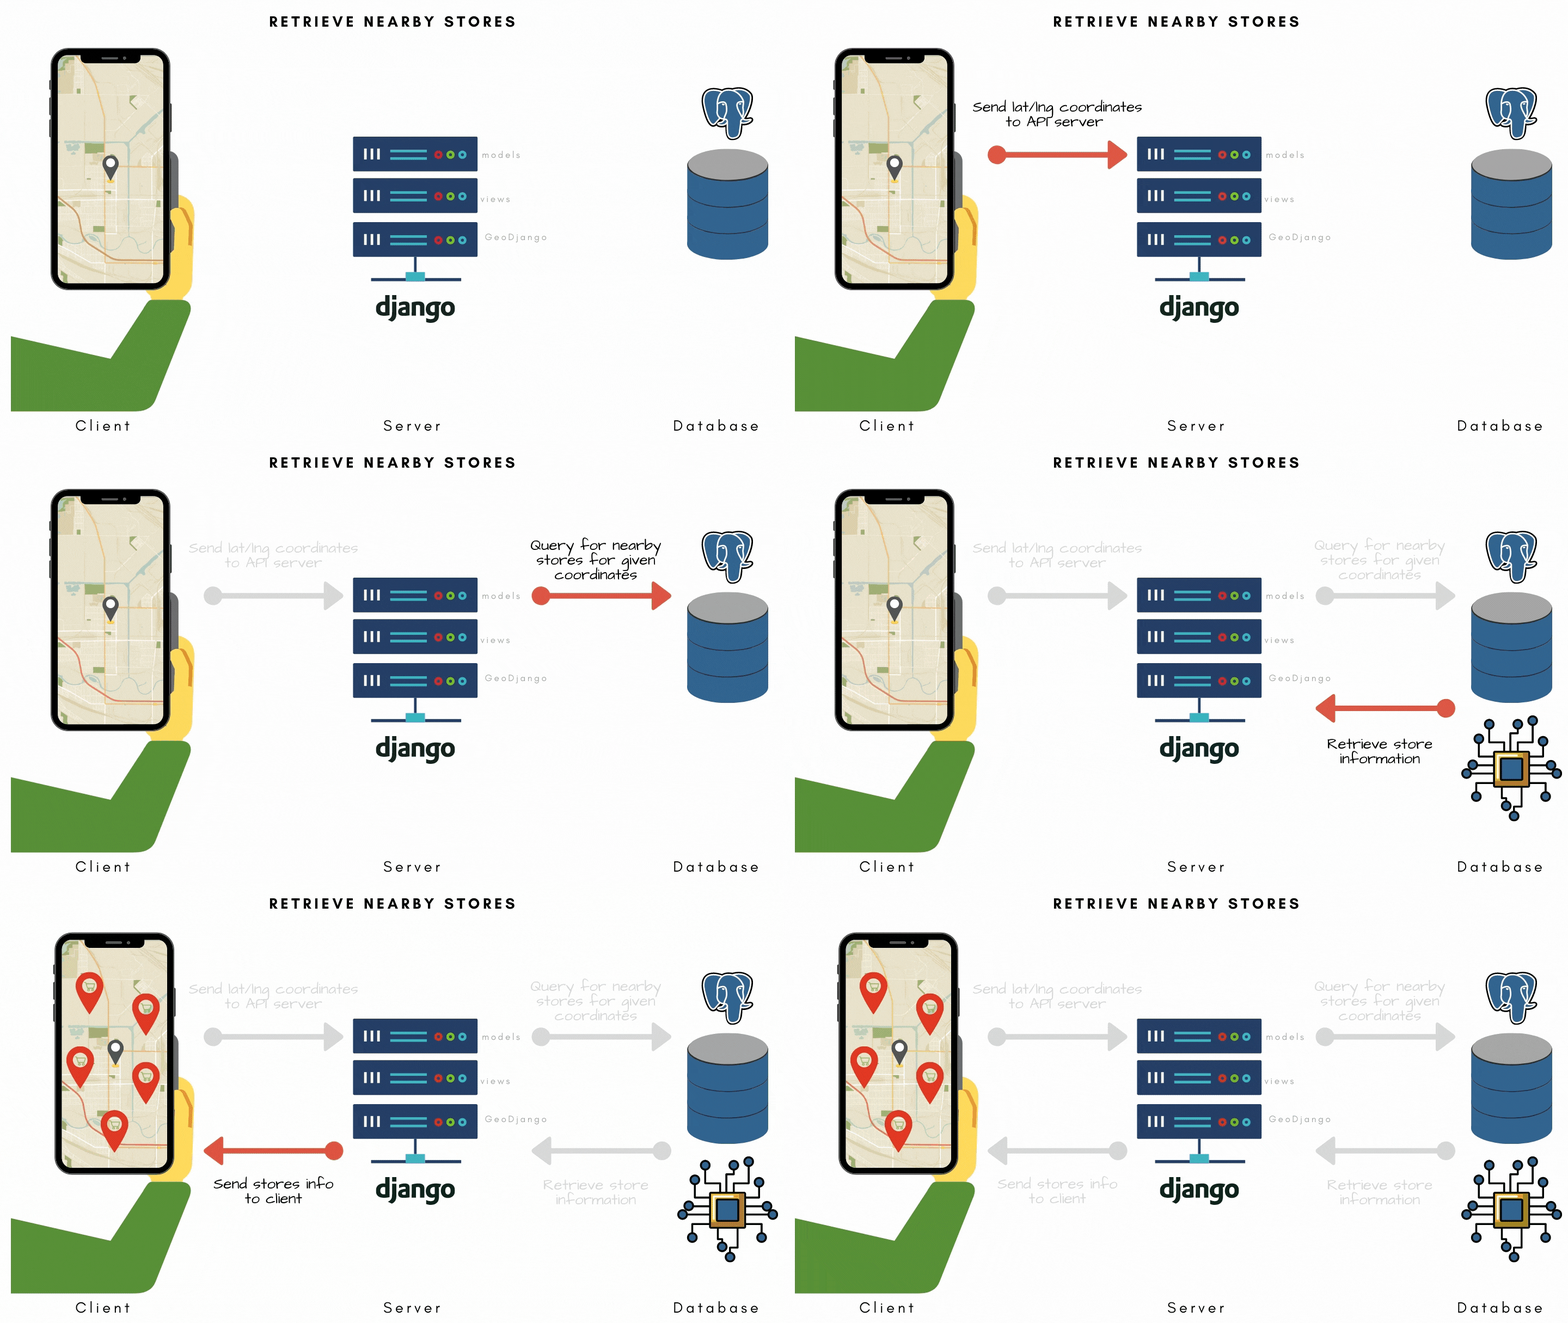
Here’s a visualization of how this service might look like
Backend
Write an API to retrieve a list of nearby stores from a pair of coordinates
Here are the components that you will need in-order to build this service in Django —
- A URL/API Route: You’ll define an endpoint called
stores/to which you could pass a pair of coordinate valueslatandlngin the request query parameters. - A View: This is essentially a request controller, that helps extract the information from a incoming request, do something with it, and send a response back. So you’ll define a view to handle the
storesendpoint, extract the latitude and longitude information from the request, and ask PostgreSQL to look up information for all nearby stores for those pair of coordinates. It is always a good idea to separate your business logic from the request, so you’ll write the PostgreSQL querying part inside services.py file of your project. - A Serializer: This helps you to control the output of your responses and what fields must they contain.
In order to build the above components, you’ll use the Django REST framework, and the built-in GeoDjango module in your project.
Step #1: Define an endpoint
Open urls.py in your code, and type the following:
from stores import views as stores_viewsrouter = DefaultRouter()
router.register(r'stores',stores_views.StoreView,basename='stores')
Here, you import your Store views from the stores/views.py file, and create a router instance using Django REST Framework’s DefaultRouter method. Then you’ll need to add this route to the list of urlpatterns — path('', include(router.urls)),.
Step #2: Define the view for your endpoint
The next step is to create the Store view that you just imported in the previous step. Add the following in stores/views.py:
A view allows you to write a handler for your API. To put it simply, it’s just a Python Class or a function that takes in a web request and returns a response.
You can use either Django’s built-in views, or in this case, a Viewset — an abstration provided by the Django rest Framework module. Using a Viewset allows you to standardize handling of APIs for commonly requested information — like returning a list, or details of a particular Model.
Since you need to return a list of Stores, you’ll use the ModelViewset and use the built-in list action for our handler. Along with this, you’ll also need to provide the following:
- A Queryset: This has the effect of querying your underlying database
- A Serializer Class: To configure your view to use a serializer.
You’ll now need to define the method get_nearby_stores_within method for querying the database for store related information. Finally, you’ll create the serializer NearbyStoreSerializer which will allow you to define what Store related information you want to return.
Step #3: Define a method to query your database for nearby stores
You’ll create the method get_nearby_stores_within to which you’ll pass latitude, longitude, a distance parameter, and an srid:
annotate: This method adds a new field (in this case, distance) to each object that is returned within a query. The value of each distance field is calculated using GeoDjango’s Distance function.Distance: This calculates the distance between two sets of coordinates — coordinates of the store location, and coordinates of the current user’s location.filter: This allows you to return only a subset of the set of objects. In this case, we want to apply a filter that selects only the objects that lie within the first x kilometres. For this, we’ll use GeoDjango’s measurement API D (alias for Distance)order_by: Finally, we’ll order the results sorted by thedistancefield that we have from the annotate step.
Step #4: Define a serializer
Open serializers.py and add the following code:
Your Store model doesn’t actually have the distance field, but was annotated while constructing the Response in the earlier step. Therefore, your Serializer must explicitly be told how to look up this information, by providing a method of the form get_annotatedfieldname.
Whew that was a lot! Run python manage.py runserver, fire up Postman or any API client of your choice (or you could use the browser as well), and go to http://localhost:8000/stores?lat=12.978624&lng=77.645296 (Replace these values with the latitude/longitude of your own). Based on the latitude and longitude information you passed in the request, you’ll see all nearby stores for that location!
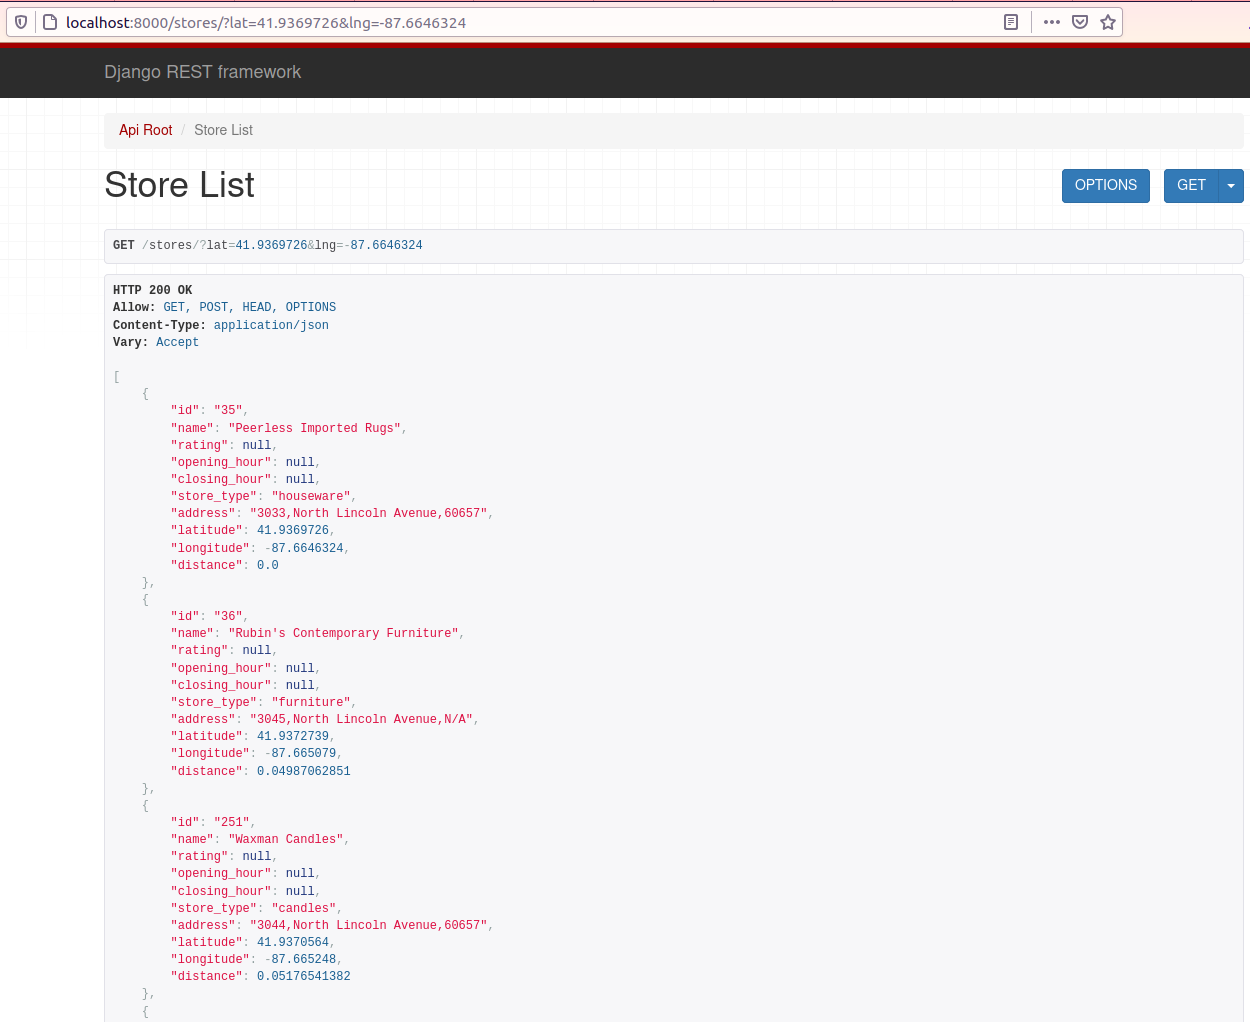
Seeing the list of stores as JSON is a good start. But that’s not nearly as fun as seeing all the stores on a map!
For this, you’ll need an HTML page. So here’s what you’ll do next:
Write an API to serve an HTML page
Your app will serve an HTML page with a welcome message when someone heads over to the URL http://localhost:8080/home?username=john.
Step #1: Define the endpoint
In-order for this feature to work, you’ll use the home Django application.
Open urls.py and add the route for your home page:
from home import views as home_viewsrouter.register(r'home', home_views.HomePage, basename='home')
Step #2: Add the view
Write this inside home/views.py:
from django.shortcuts import render
from rest_framework import viewsets
from rest_framework.decorators import action
from rest_framework.response import Response
from rest_framework.renderers import TemplateHTMLRenderer\# Create your views here.
class HomePage(viewsets.GenericViewSet):
    renderer_classes = [TemplateHTMLRenderer]
    template_name = 'home/index.html'def list(self, request):
        username = self.request.query_params.get('username')
        return Response({'username': username})
Upon hitting the endpoint, Django will now look for the file index.html within the home/templates folder. Then, it intrapolates the variable username in the template file with the value that you provide in the query params — so when you open the page, you’ll see “Welcome, john” displayed in the UI.
Frontend
In your home application, Here are the relevant functions that you’ll work on:
map/addMap(): For loading the map.map/addGeocoder(): For adding a search box in the map with autocomplete feature.api/fetchNearbyStores(): For making a network request to fetch nearby stores from a given latitude and longitude.map/convertToGeoJson(): For converting the fetched stores to GeoJSON.map/plotStoresOnMap: For plotting the stores on the map.
There is some boilerplate JavaScript code inside index.js that calls the above methods. So you’ll just need to write the logic for making the relevant functions work.
Note: Since the focus of this tutorial is on logic and not styling, all the relevant boilerplate HTML and CSS code along with the relevant files like stylesheets, icons, and client-side libraries etc have already been included for you,. You’ll find these files within the /home/static/home folder.
Step #1: Load the map
First, create an account on Mapbox and add an access token. Copy and paste it inside home/js/map.js:
mapboxgl.accessToken = 'your-secret-token';
In the same file, add the following the addMap() function:
const map = new mapboxgl.Map({
    container: 'map',
    style: 'mapbox://styles/mapbox/light-v10',
    center: [77.645296, 12.978624],
    zoom: 2
});

map.addControl(new mapboxgl.NavigationControl());

return map;
Refresh the page, and you should now see a map rendered inside the div element #map! Let’s also add an autocomplete field in the map. Add the following inside the addGeocoder() function:
const geocoder = new MapboxGeocoder({ accessToken: mapboxgl.accessToken, mapboxgl: mapboxgl });map.addControl(geocoder);geocoder.on("result", (data) => {
    geocoderCallback(data);
});
So you’ll be able to type the name of your neighborhood on the search box (for example, Lincoln Square, Illiniois, Chicago). Upon selecting the place, it will pass the data of that place (along with its coordinates) to the geocoderCallback. You’ll then be able to use the latitude and longitude information to hit the /stores endpoint that you wrote earlier, and get back a list of stores as JSON.
Step #2: Fetch nearby stores and convert them to GeoJSON
For displaying those little green store markers on the map, Mapbox needs data to be in the form of GeoJSON. GeoJSON is a format for encoding a variety of geographic data structures. This is how it looks like:
{
    type: "FeatureCollection",
    features: [
        {
                type: "Feature",
                geometry: {
                    type: "Point",
                    coordinates: [<longitude>, <latitude>]
                },
                properties: {
                    <field1>: <value1>,
                    <field2>: <value2>,
                        ...
                }
        }
        ...
    ]
}
Write the following within the convertToGeoJson function inside map.js:
function convertToGeoJson(stores) {return {
    type: "FeatureCollection",
    features: stores.map(store => {
        return {
            type: "Feature",
            geometry: {
                type: 'Point',
                coordinates: [store.longitude, store.latitude]
            },
            properties: {
                id: store.id,
                name: store.name,
                address: store.address,
                phone: store.phone,
                distance: store.distance,
                rating: store.rating,
            }
        }
    })
  }}
Finally, you’ll have a function called plotStoresOnMap inside that takes in 2 arguments — map, and stores in the form of GeoJSON, and plot those pretty little green icons on the map!
function plotStoresOnMap(map, storesGeoJson) {
    for(let store of storesGeoJson.features) {
        // create a HTML element for each feature
        let el = document.createElement('div');
        el.className = 'store';
        el.title = `${store.properties.name}\n` +
        `approximately ${store.properties.distance.toFixed(2)} km away\n` +
        `Address: ${store.properties.address || "N/A"}\n` +
        `Phone: ${store.properties.phone || "N/A"}\n` +
        `Rating: ${store.properties.rating || "N/A"}`; // make a marker for each feature and add to the map
        new mapboxgl.Marker(el)
            .setLngLat(store.geometry.coordinates)
            .addTo(map); el.addEventListener('click', function(e) {
            updateSelectedStore(store.properties.id);
        });
    }
}
For each store, you create an HTML Div element and add the relevant information of the store such as the name, contact details, how far away it is, etc on the title attribute. So when you place your mouse over the marker, you’ll see this info on a tooltip!
Then, you create a new Mapbox marker using the element, set its coordinates, and add it to the map! You also have an event listener that watches for any click events on a marker. If you select a particular store by clicking on it, it will assign a global variable STORE with the store’s unique ID.
Note: The
titleattribute isn’t great for accessibility. You’ll learn a better technique later.
And that’s it! Refresh the page, and on the input box displayed on the map, type in a place within the city that you added the data for earlier (for example, Lincoln Park, Chicago). Upon selecting the place, the geocoderCallbackruns a function called displayNearbyStores(inside stores.js). This method fetches the nearby stores using the Fetch API, converts them to GeoJSON using convertToGeoJson, and plots them on the map using plotStoresOnMap.
And, we’re done!
What’s next?
In the next part, you’ll learn to extend this service further with additional features needed for the service:
- A feature to add a wishlist of essential items to purchase from a nearby store using a simple user interface.
- A location-based wishlist discovery service that will show you wishlists created by other people in the neighborhood.
- Ability to accept a wishlist from another user and purchase the items on their behalf.
So take a break, get something nice for yourself from your favorite store, and proceed with Part 2
Originally published in Egen Engineering.
-
Here’s a list of several such useful applications built using OSM. Many of these projects need contributors in various roles — I highly encourage you to find one that you like and offer any help that you can! ↩︎
-
BTW, did you know that gamers have used this tool to find pokemon habitats in the Pokemon Go Game? 😉 ↩︎